Skip to content
Money Vikings – Truewealth

Money Vikings – Truewealth

Conquer Financial Freedom and True Wealth!

  • YouTube
  • Investing
  • Budgeting
  • Building Wealth
  • Health
  • About
    • Why Upgrade To Premium? Who Are We?
    • Subscribe Now! To Our $10/month Premium Plan
    • Finance Blogs To Follow
    • Affiliates/Books
    • Terms of Service
    • Privacy Policy

Using Python and mplfinance to Generate Graphs for Options Trading

Posted on February 8, 2025March 14, 2025 By Jerry
Options

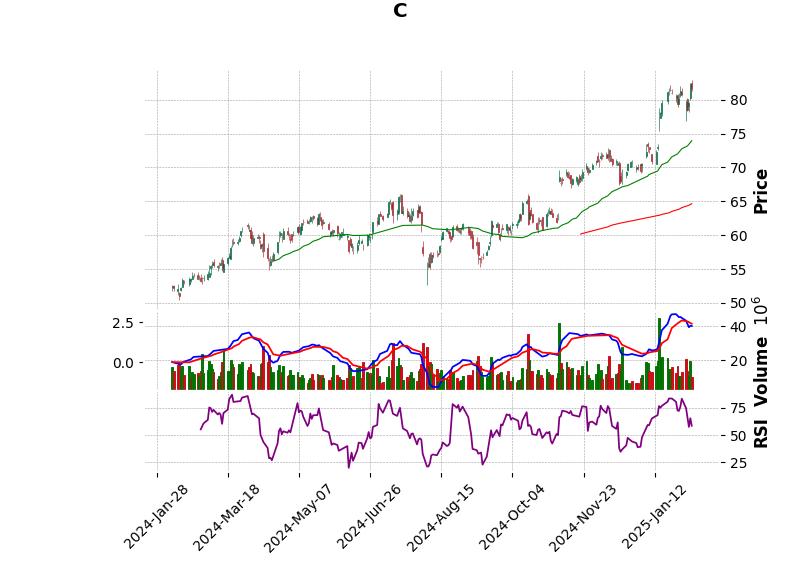
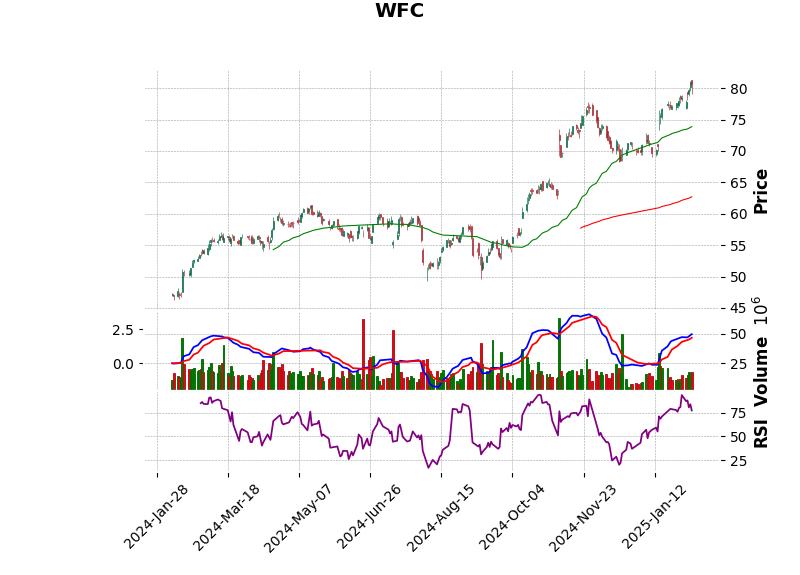
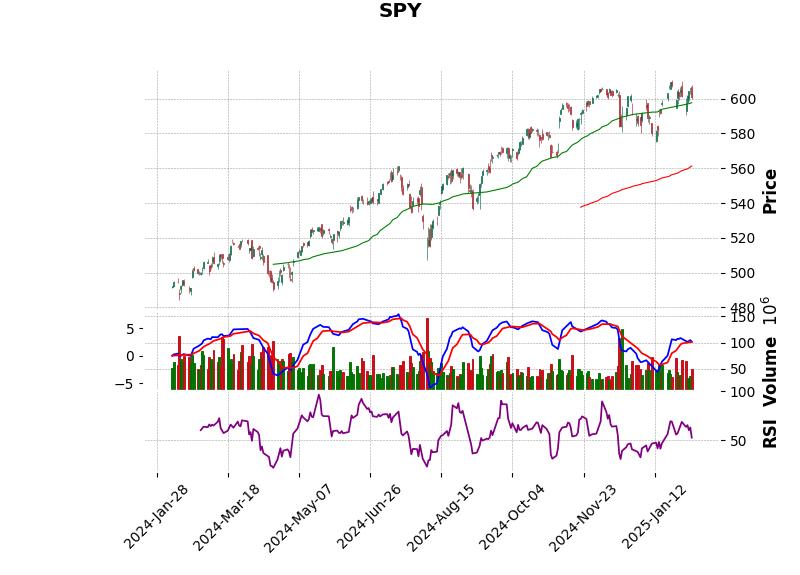
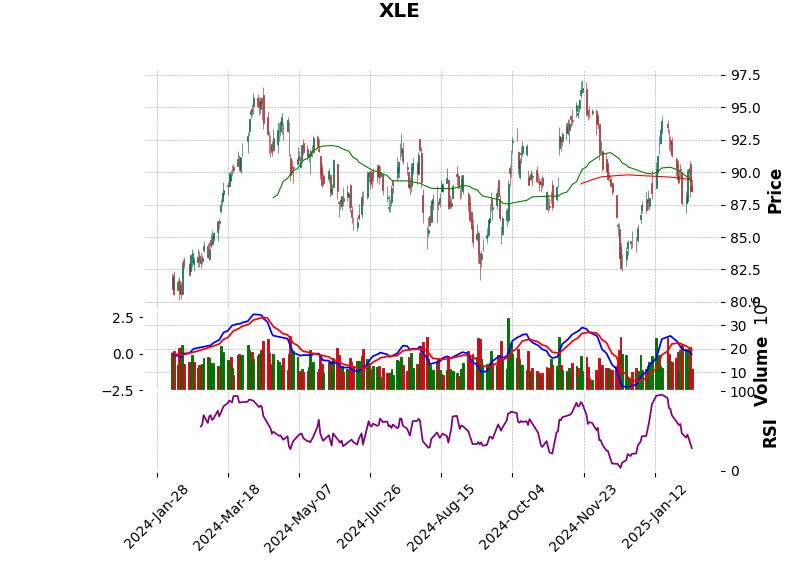
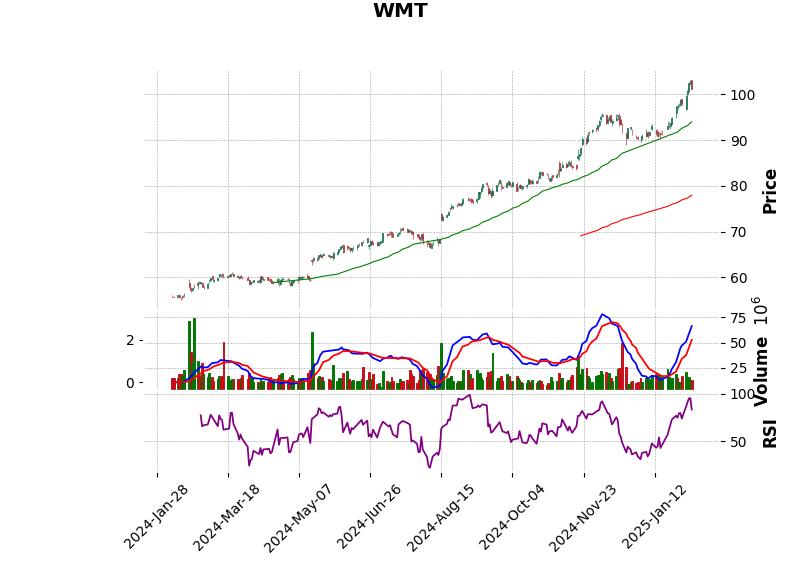
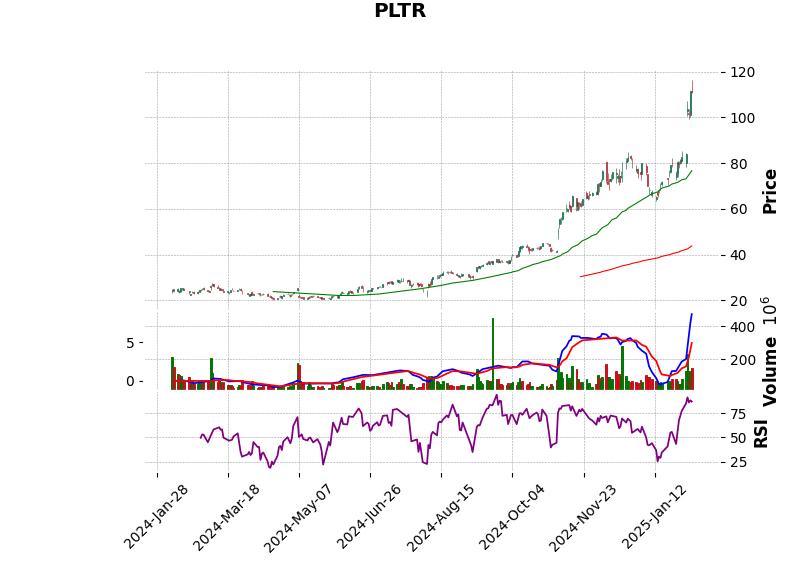
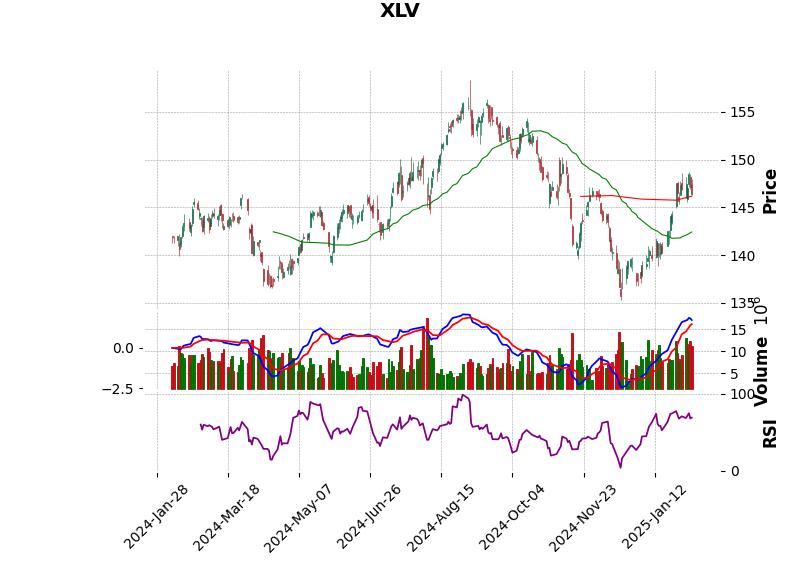
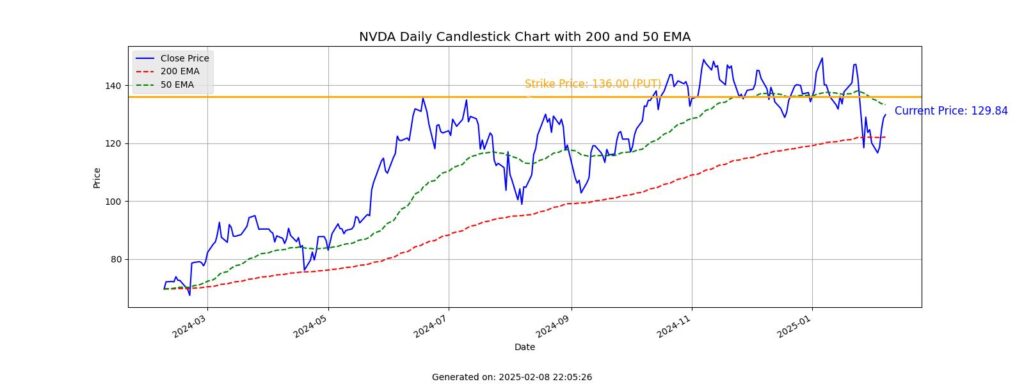
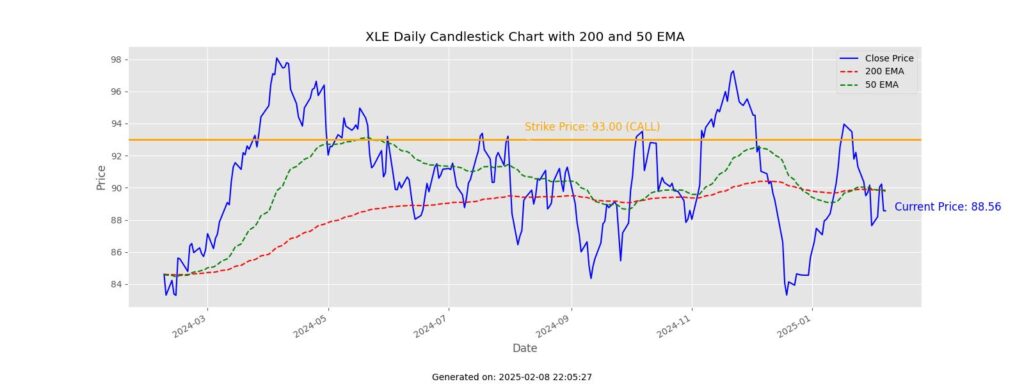
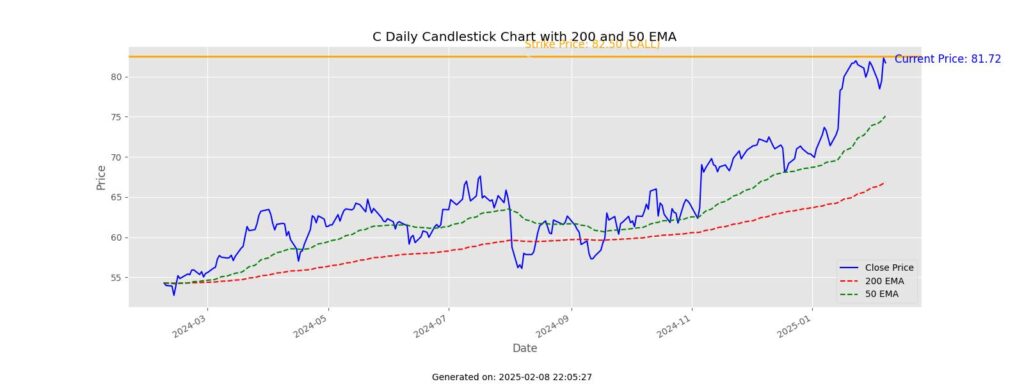
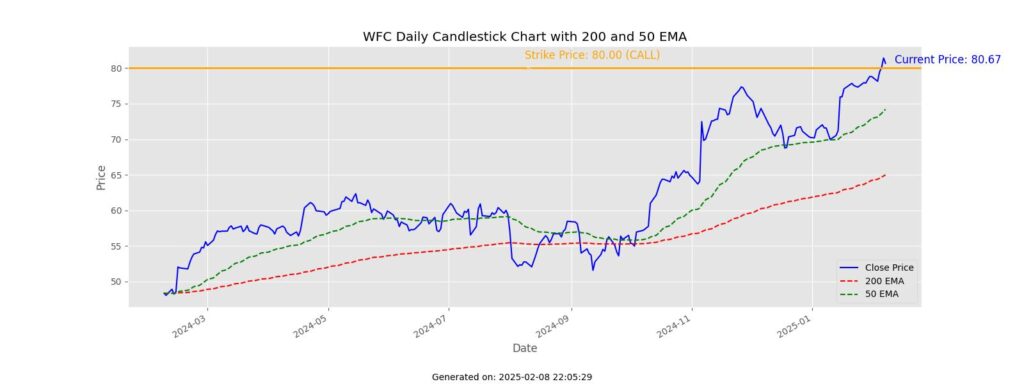
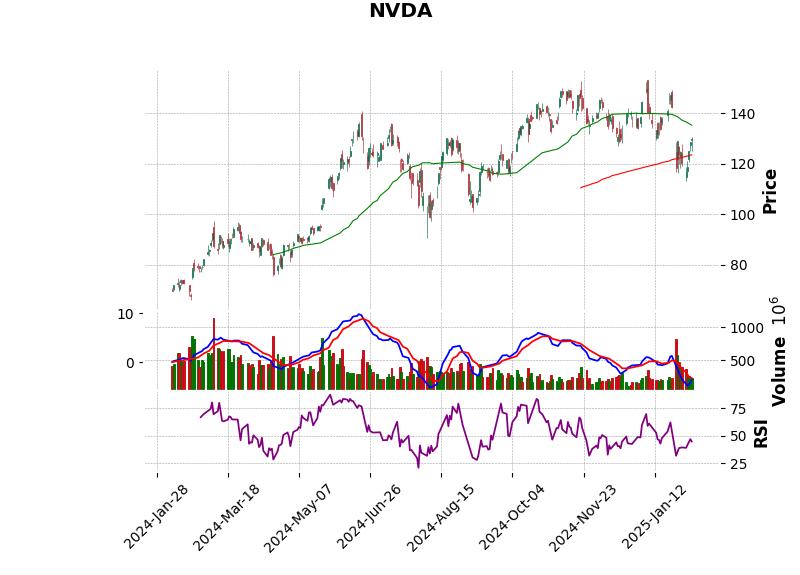
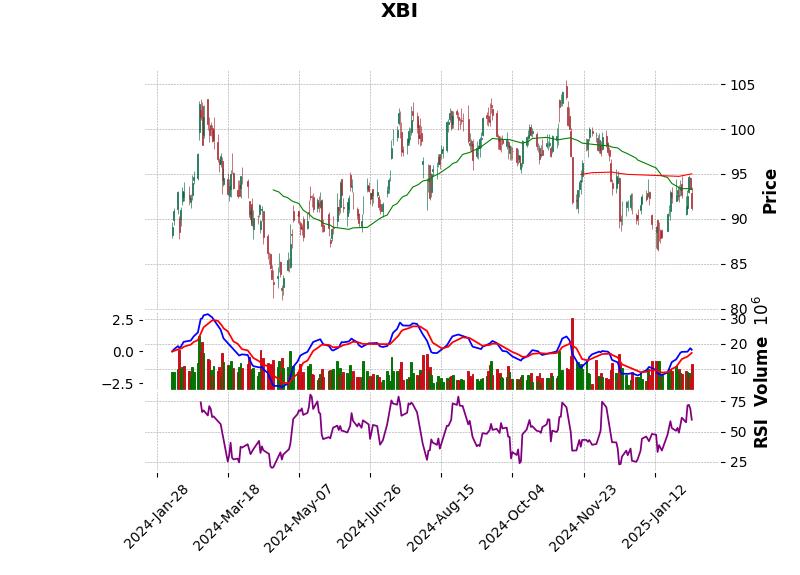
I’ve been working on some python code and the mplfinance, matplotlib, yfinance python libraries to generate the images below. Many of them I have covered called or cash covered puts in which I roll monthly.

import yfinance as yf
import matplotlib.pyplot as plt
import mplfinance as mpf

There are a couple types of graphs. The first type are candlestick charts that have the RSI, MACD, and 50/200 Exponential Moving Averages. The second type is a line graph with the EMAs, but also have a yellow line drawn at the strike of my call or put. It’s a nice visualization for me and gives me a quick sense of where the trade is headed. I’d like to combine the 2 into one and move to a weekly, but also add a simple daily line graph to get a sense of the trading day.

Are there indicators you would like to see added that have helped you trade options? Perhaps Average True Range or Bollinger Bands?
Tags: charting options programming python trading

Post navigation

❮ Previous Post: Time to Accumulate Bitcoin
Next Post: Bitcoin Valentine’s Day ❯

Search Our Articles

Track all markets on TradingView
Sign up for our Free Newsletter

Tag Cloud

401K 2023 bitcoin Bonds cash back ChatGPT collectibles Compound Interest contrarian covered call crm Dividends earnings finance financial freedom FIRE futures health heatmap home ownership hottrades investing investment iron condor Johnson & Johnson O options Personal Finance QQQ rates real estate investing Real estate investment trusts Realty Income REIT REITs salesforce saving spiderman spy Stock stocks technology trading vix Wealth

Better Uptime Website Monitoring


Copyright © 2025 The Money Vikings – Truewealth.

Theme: Oceanly by ScriptsTown